The graph shows the variation of the product PV with respect to the pressure § of given masses of three gases A, B and C. The temperatures is kept constant, Fig. state with proper arguments which of these gases, is ideal.
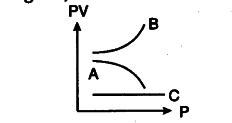
Gas C is ideal, because PV is constant for this gas. It means the gas C obeys Boyle’s law at all pressures