Locate the Mode graphically.
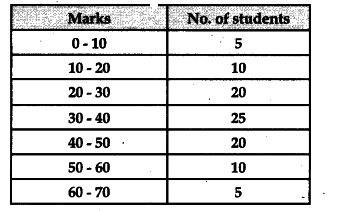
Firstly, we draw the histogram of the given data. Here, maximum height of rectangle is 25.00 modal class is 30 - 40.
MO = 35
It is clear from the histogram that the value of mode is 35.
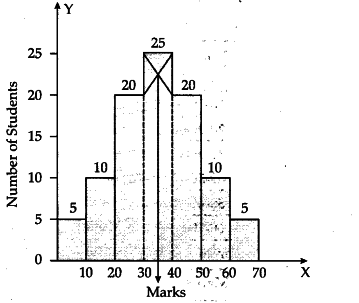
Locate the Mode graphically.
Firstly, we draw the histogram of the given data. Here, maximum height of rectangle is 25.00 modal class is 30 - 40.
MO = 35
It is clear from the histogram that the value of mode is 35.