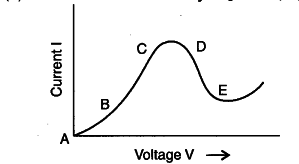
Graph showing the variation of current versus voltage for a material GaAs is shown in the figure, Identify the region of :
(i) negative resistance
(ii) where Ohm’s law is obeyed.

DE : Negative resistance region.
AB : Where Ohm’s law is obeyed. (Also accept BC)