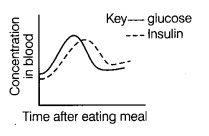
Following graph shows the changes expected after a meal containing starch.
What inference can you draw from the graph shown?
Following graph shows the changes expected after a meal containing starch.
What inference can you draw from the graph shown?
The graph shows the concentrations of glucose and insulin in the blood of a healthy person. The increase in production of insulin converts the excess of glucose into glycogen fot storage in liver and muscles.