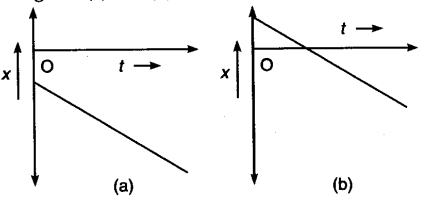
What is common between two graphs shown in figures (a) and (b) ?

Both these graphs represent that the velocity is negative.
What is common between two graphs shown in figures (a) and (b) ?

Both these graphs represent that the velocity is negative.