The Law of Supply states that other things being equal, quantity supplied increases with the increase in price and decreases with the decrease in price of a commodity.
It can be explained with the help of following schedule and diagram:
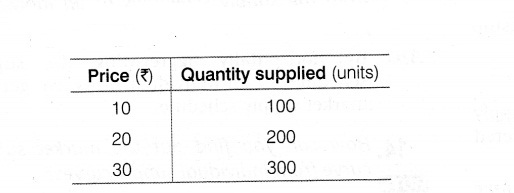
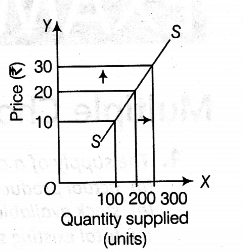
The supply schedule shows the positive relationship between price and quantity supplied. This is in accordance with the Law of Supply.
SS is the supply curve sloping upward. It shows a positive relationship between price and quantity supplied of a commodity.
When price increases from Rs 10 to Rs 20, quantity supplied increases from 100 to 200 units.