The stress-strain graphs for materials A and B are shown in figure. The graphs are drawn the same scale and 0
(a) Which of the materials has the eraction Young” s modulus ?
(b) Which of the two is stronger material ?
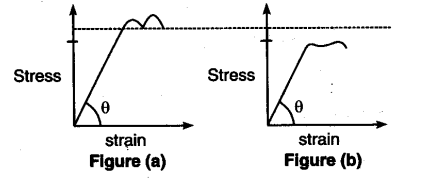
(a) From graph it is clear that for a given strain, stress for A is more than that of B. Hence Young”s modulus (= stress/strain) is greater for A than that of B.
(b)A is stronger than B. Strength of a material is measured by the amount of stress required to cause fracture, corresponding to the point of fracture.