The given graphs show the variation of intensity of magnetisation I with strength of applied magnetic field H for two magnetic materials P and Q.
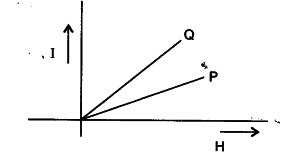
(i) Identifiy the materials P and Q.
(ii) For material P, plot the variation of intensity of magnetisation with temperature. Justify your answer.
(i) P - Paramagnetic material
(ii) Q - Ferromagnetic material
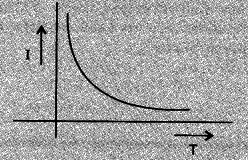
In paramagnetic materials, I decreases with temperature as, I\propto \frac { H }{ T } where H is the magnetising field.