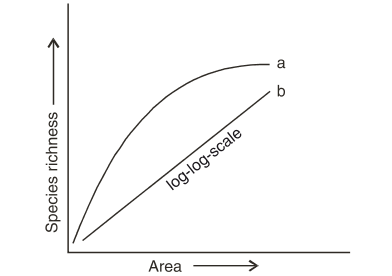
The following graph shows the species-area relationship.Answer the following question as directed.
(a) Name the naturalist who studied the kind of relationship shown in the graph.Write the observation made by him.
(b) Write the situations as discovered by the ecologists when the value of ‘Z’(slope of the line) lies
(i)0.1 and 0.2
(ii) 0.6 and 1.2
What does ‘z’ stand for?
© When would the slope of the line ‘b’ become steeper?
(a) Alexander Von Humboldt.Within a region species richness increased with increasing explored area but only up to a limit.
(b)(i) The slopes of regression lines are similar/ unaffected distribution in an area/ normal range.
(ii) The slope of regression is steeper when we analyse the species area relationship among very large areas like entire continent.Z(slope of the line) regression co-efficient.
© If species richness is more/ 0.62-1.2