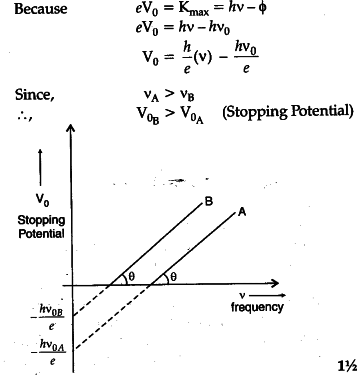
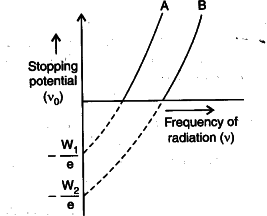
Sketch the graphs showing variation of stopping potential with frequency of incident radiations for two photosensitive materials A and B having threshold frequencies
![]()
(i)which case is the stopping potential more and why ?
(ii) Does the slope of the graph depend on the nature of the material used ? Explain. [O. D. I, II, III 2016]
(i) The stopping potential of material ‘B’ is greater than that of ‘A’.

Therefore, stopping potential of ‘B’ is greater than A
(ii) The slope of stopping potential versus frequency of incident radiations gives the ratio of planck’s constant and electronic charge.

Fig. Graph showing variation of stopping potential with frequency of variation
1 Like