Learn CBSE Forum
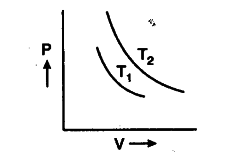
Show the graph between pressure (P) and volume (V) at constant temperature
CBSE Class 11
CBSE Class 11 Physics
cbse
,
kinetictheoryofgases
prasanna
August 22, 2016, 10:34am
1