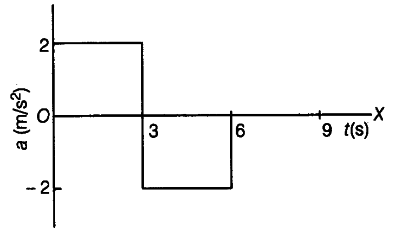
At t -=0, a particle is at rest at origin. Its acceleration is 2 m/${{s}^{2}}$ for the first 3s and - 2 m/${{s}^{2}}$ for next 3s.
Plot the acceleration versus time and velocity versus time graph.
The acceleration-time graph is
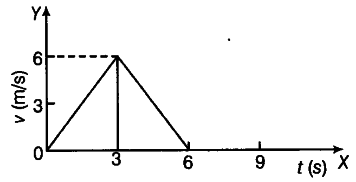
The area enclosed between a-t curve gives change in velocity for the corresponding interval.
At t = 0, v = 0, hence final velocity at t = 3 s will increase to 6 m/s. In next 3 s, the velocity will decrease to zero. Thus, the velocity-time graph is