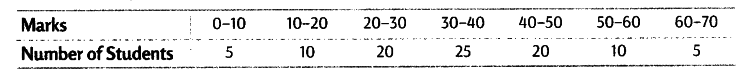
Locate the mode graphically.
Firstly, we draw the histogram of the given data. Here, maximum height of rectangle is 25.50 modal class is 30-40
It is clear from the histogram that the value of mode is 35.