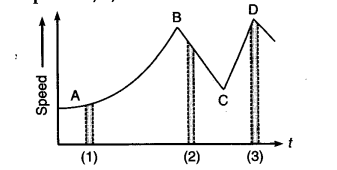
Figure gives a speed-time graph of a particle in motion along a constant direction. Three equal intervals of time are shown. In which interval is the average acceleration greatest in magnitude ? In which interval is the average speed greatest ? Choosing the positive direction as the constant direction of motions give the signs of v and a in the three intervals. What are the accelerations at the points A, B, C and D ?
The magnitude of the average acceleration is given by Change in speed/Time interval
i.e., average acceleration in a small interval of time is equal to the slope of v-t graph in that time interval. As the slope of v-t graph is maximum in the interval 2 as compared to intervals 1 and 3, hence the magnitude of average acceleration is greatest in interval 2.
(ii) The average speed is greatest in the interval 3 as
perk D is at maximum on speed axis.
(iii) v > 0, i.e., positive in all the three intervals.
(iv) The slope is positive in intervals 1 and 3, so V, i.e.
acceleration is positive in these intervals while the slope is negative in interval 2, so acceleration is negative in it.
i.e., a > 0, i.e., positive in interval 1 and 3. and, a < 0, i.e., negative in interval 2.
As speed is same at points A, B, C and D, hence the acceleration is zero at all the four points