The relationship between the savings and income is known as saving function.
S = F(Y)
When we write the saving function as an algebraic expression, we get,
S = -\overline{S} + sY.
Where, S = Saving,
-\overline{S} = Saving at zero level of income, s = Marginal Propensity to Save, Y = Income
Let us understand saving function with the help of an imaginary schedule and diagram:
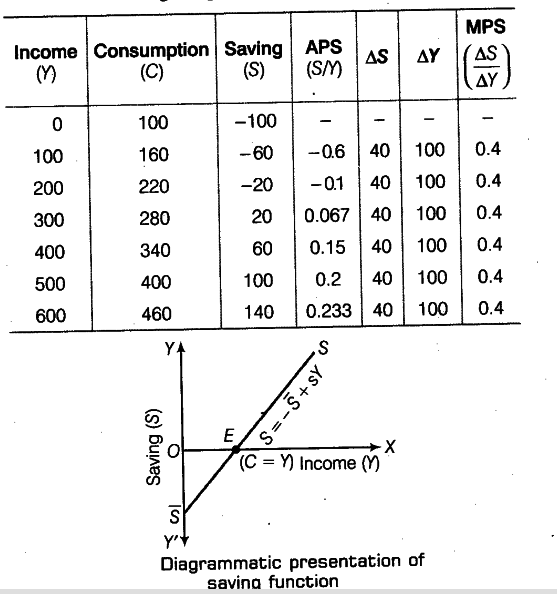
In the diagram, E is the point when savings become zero from negative. Beyond E, saving is positive.