Explain how two samples can have the same mean but different standard deviations. Draw a bar graph that shows the two samples, their means, and standard deviations as error bars.
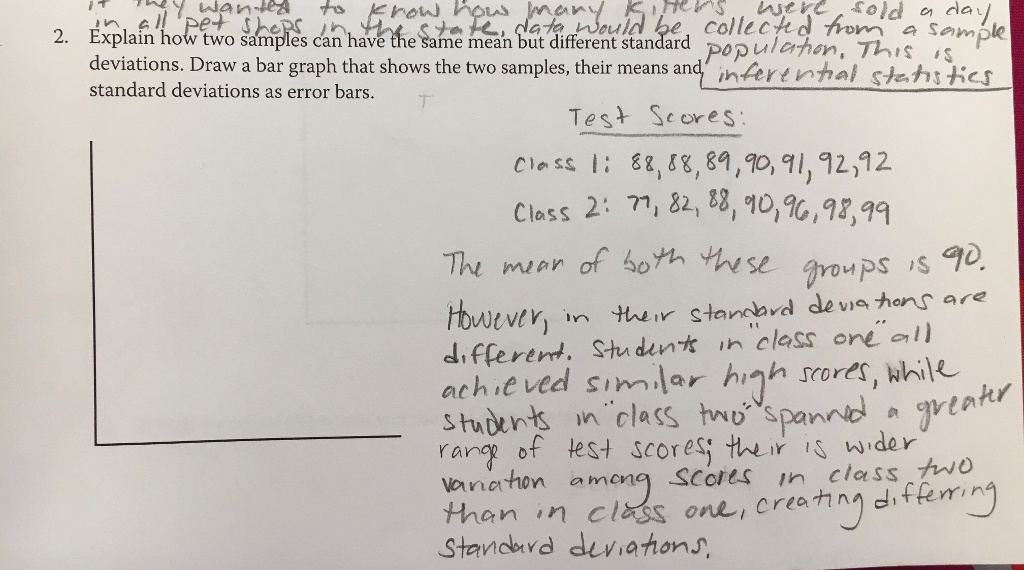
CAVA from a populaton. This is 2. Explain how two samples can have the same mean but different standard deviations. Draw a bar graph that shows the two samples, their means an intertntal states ties standard deviations as error bars. Test Scores class g 8g, 89,90, 92, 12. Class Thu mian of both these groups is go Wtver) in their standard de v a horns are different, sludint in "eless one all achieved similar high scores, while in two spannd greate rang f test scores their is wider vanahon among scores in class than in clas one, creating differin Stancourd duratons.
Answer:
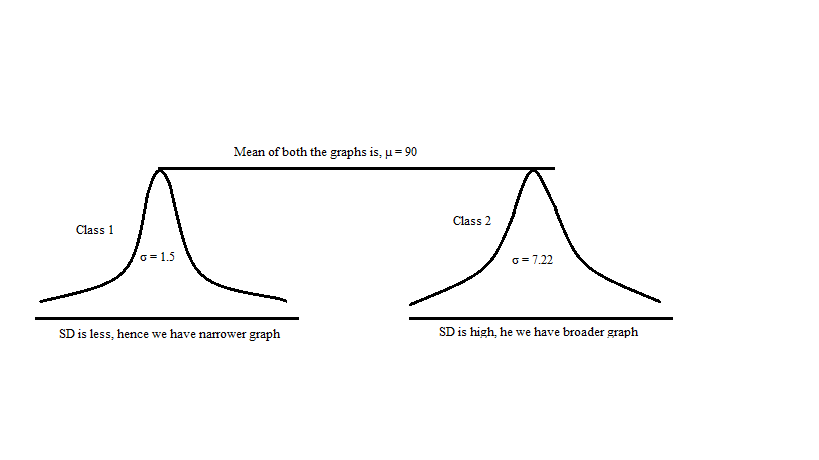
Class 1:
88, 88, 89, 90, 91, 92, 92
Mean = 90
Stdandard Deviation = 1.5
Class 2:
77, 82, 88, 90, 96, 98, 99
Mean = 7.22