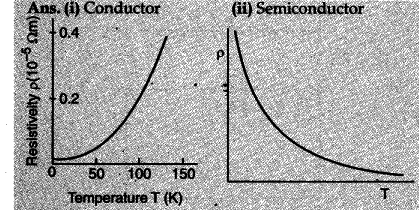
Draw a plot showing the variation of resistivity of a (i) conductor and (ii) semiconductor, with the increase in temperature.
How does one explain this behaviour in terms of number density of charge carriers and the relaxation
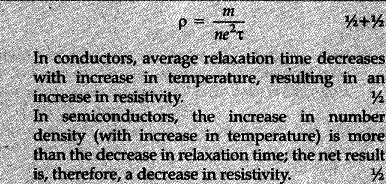
Draw a plot showing the variation of resistivity of a (i) conductor and (ii) semiconductor, with the increase in temperature.
How does one explain this behaviour in terms of number density of charge carriers and the relaxation