Draw a graph for a wave representing wave disturbance and time for a sound changing from low pitch to high pitch, keeping the amplitude of the sound same.
Answer:
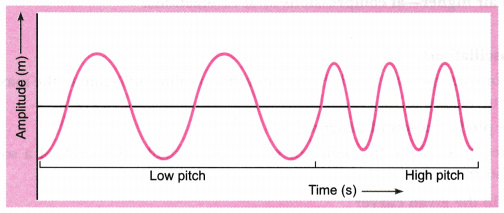
Draw a graph for a wave representing wave disturbance and time for a sound changing from low pitch to high pitch, keeping the amplitude of the sound same.
Answer: