Compare the diagrams given below and find out the land use category which had the highest, increase during the period 1960-61 to 2008-09 and the category Which had the highest decrease during the period. Give one major reason for each.
Compare the diagrams given below and find out the land use category which had the highest, increase during the period 1960-61 to 2008-09 and the category Which had the highest decrease during the period. Give one major reason for each.
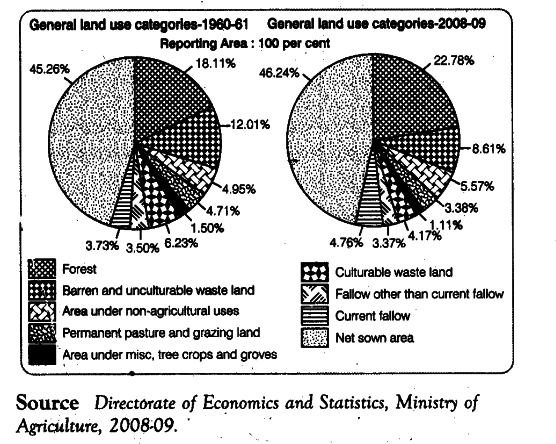
The highest increase was in forest cover category and the highest decrease was in barren and unculturable waste land category:
It is discouraging to note that in spite of massive efforts made by the government to increase forest cover, the area under other non-agricultural uses is still increasing. It is probably due to deforestation, overgrazing and natural hazards etc that forest cover is still below the outline which was set in the National Forest Policy (1952), The decline in barren and waste land can essentially be attributed to the increase in area under non-agricultural use due to massive urbanization and development of roads, railways and canals etc.